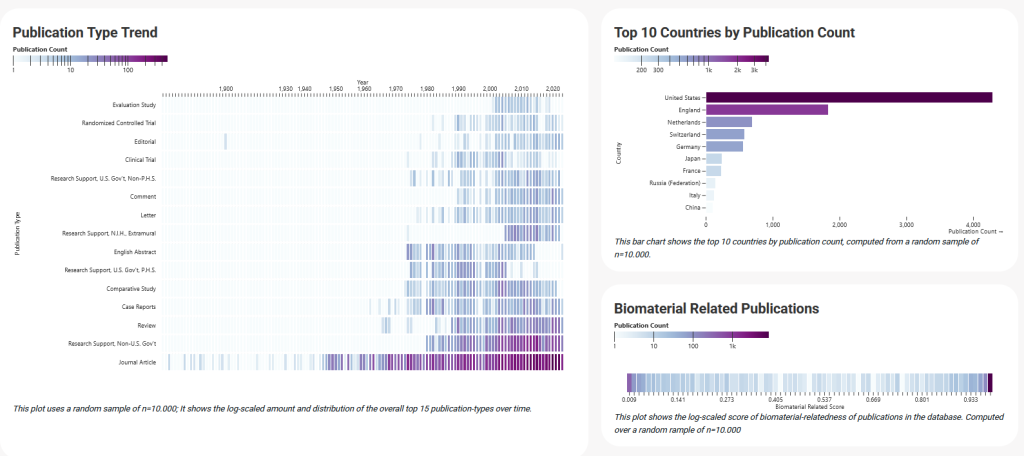
This page provides a quick overview of the database’s scope and coverage, highlighting key metrics—such as publication counts, trends, and biomaterial-related terms—through static visualizations. These snapshots update continuously as data integration progresses, offering immediate insight into the size and focus of the database.
For more targeted analysis, perform a search on the homepage and select “Visualise Associations” to view dynamic, search-specific visualisations. This combination of high-level statistics and in-depth analysis helps you efficiently explore the database and discover relevant information for your research needs.
All visualisation are based of a random radom sample of 10.000 publications of the entire 37.000.000+ publications. This sample was created on 11.02.2025.

Quick insights, and hard facts about the data allow the user to get a first idea of the size of the database.

Static visualisations to further provide insights: Publications over time; Assessment of publications in relataion to Female/Male associated MeSH terms.

Type of publication over time as a pixel-based time-series visualisation; Top-10 Countries based on the publication count; Plotting the biomaterial relatednes of the publications in the database.


